
It is easy and natural to think of the woes of the West's main powers as an economic problem. Because that's the way it is presented to us. And it is economic - at least, superficially. But if you take a step back, what we're really living through is the decline of the West.
It's not just about Spain's debts and Europe's currency, or even just about Europe. It's not just about Washington's deficits and the US recession, or even just about the US.
These are the symptoms and the locations of a common dysfunction, not driven by some remote economic force but by people and politics. That dysfunction is very human, very normal and very simple. The central driver in the decline of the West is indulgence.
This indulgence has worked through three channels. First is government spending. In country after country, political leaders have indulged their electorates and powerful special interests. They gave in to demands and pressures and expectations. They spent money they didn't have. Everyone wants more handouts and bigger subsidies but no one wants to pay more taxes. Political leaders are supposed to manage these conflicting pressures in the national interest. They did not. The deficits began and didn't stop. They piled up.
The main powers of the Western bloc, since World War II at least, have included not just western Europe and the US but also Japan. All three of these huge economies have been guilty of extravagant spending and inadequate taxing.
The pensioners and public servants and governments of Greece have had a lot of bad press in the last year or two for their indulgence. They've been roundly abused for expecting too much in welfare payments and retirement benefits and for not paying enough tax.
And it's true there has been quite a bit of wasteful middle-class welfare and ill-disciplined social welfare paid to the voters of many eurozone countries. But most of the governments of Europe have also wantonly indulged powerful special interests.
Farmers, for example. Almost half the European Union's annual budget - 47 per cent - is spent on subsidies to farmers. The Common Agricultural Policy props up hopelessly uncompetitive farmers who should have gone out of business.
But they are a powerful and organised political force, so they get paid for being uncompetitive. This is a weakness shared by Japan and the US, too, though not as extravagantly.
The most famous American subsidisation of a special interest is its wasteful spending on military programs. In the early 2000s, the US accounted for only 5 per cent of world population but just under half of all global military spending. Another way of putting it is that the US spent almost as much on defence as the other 190 countries of the world put together.
Japan's special fetish has long been construction spending. Not just since the tsunami but for decades before that. In 2003, for instance, it spent 40 per cent of the national budget on construction in what was already one of the world's most overbuilt countries.
One reason was the fact that, for a long time, the construction sector kicked back a share of the money to the politicians who decided the spending. Under the reign of one former top figure in the long-ruling Liberal Democratic Party, Shin Kanemaru, it was a fixed 2 per cent cash kickback on contracts awarded - a huge pay-off.
The second channel through which indulgence was exercised was the central banks. Central banks in Japan, then the US and Europe, made money too cheap for too long. It was an indulgence. But it was a fatal one.
Central banks were granted independence from politicians for an excellent reason - most people love low interest rates and politicians love giving people what they want. But if you keep rates too low for too long, it pushes up prices and creates terrible problems. Until the 1980s, excess money went into the price of consumer goods and you got inflation breakouts.
But from the '80s onwards, something changed. Excess money started flowing into the price of assets instead - shares and real estate, in particular. The Japanese let this happen in the '80s and when the ''bubble economy'' popped, it went into a slump from which it is still recovering.
The US - telling itself it was special and different and better and, in any case, it had the genius Alan Greenspan - made exactly the same mistake. It got the same result.
Why did it do it? Greenspan, as Jim Grant of Grant's Interest Rate Observer sagely said, was a better politician than he was a central banker. He kept the great American party going and became a national hero for doing it, even though it was intoxicated on cheap money, until it came to its inevitable end.
The third channel was the banking sector and the high-rolling investment banks in particular. Politicians and regulators in the US, mainly, but also in Europe, indulged the fantastic profitability and the generous political donations of the investment banks.
Under cover of the ideology of the free market and its supposedly miraculous ability to reach perfect equilibrium, they created new and virulent ways of profiteering from the great gushers of cheap money flowing from the central banks. Subprime mortgage lending was one.
Of course, when it all crashed, the political leaders had to bail out the banks. And that was expensive. The cost was added to the towering public debts that the politicians had already accumulated. And so the cycle feeds itself anew.
By last year, the average public debt of the eurozone nations was 82 per cent of the size of their total gross domestic product, far above the permitted maximum of 60 per cent. In the US, the figure was 103 per cent. In Japan it was 230 per cent.
As these great Western powers grew richer, they grew flabbier and more indulgent to the point of collapse.
It's a very old story in the history of civilisations, told anew in our time.
Why we're in the state we're in
Why we're in the state we're in
“If you trust in yourself, and believe in your dreams, and follow your star. . . you'll still get beaten by people who spent their time working hard and learning things and weren't so lazy.”
Re: Why we're in the state we're in
"the decline of the West" I've been hearing that tripe for 40 years. Go pull the other one.
yrs,
rubato
yrs,
rubato
Re: Why we're in the state we're in
Gob, do you agree with what is asserted in this article?
I do.
I do.
Re: Why we're in the state we're in
Not particularly, I just put these things up as debate starters.
“If you trust in yourself, and believe in your dreams, and follow your star. . . you'll still get beaten by people who spent their time working hard and learning things and weren't so lazy.”
Re: Why we're in the state we're in
There has been a minor industry in writing this kind of thing for as long as I've been alive. It is especially popular in the fundie-religious or nutcase conservative groups (to the degree those are different). The theme for many decades was to attempt to compare [the United States, Europe, The "Western Powers" or whatever the fuck] with the Roman Empire just before its collapse. If your audience is almost wholly ignorant of history that sort of direct fraud can work wonders. If they are, in addition, given to a mis-application of moral reasoning when practical reason is really called for, its like shooting fish in a barrel.
yrs,
rubato
yrs,
rubato
Re: Why we're in the state we're in
Like it or not, a couple generations ago, the vast majority of the U.S. population was of a uniform mind that unless the country was in an extraordinarily bad situation (e.g., war, world-wide economic depression), the U.S. Federal government ought to operate on a pay-as-you-go basis. To do otherwise was to be irresponsible and wasteful.
When the first large deficits started rearing their ugly heads, the Public felt that they were both irresponsible and unsustainable (i.e., stupid). But over a few decades, we observed that the sky did not cave in because of our incomprehensibly large national debt, and we saw more and more people getting unprecedented bennies from government. Politicians catered to this with a cornucopia of programs, funding housing, small businesses, "education," special services for the actually and dubiously "disabled," and so on.
Now a majority of the population, both here and in Europe just doesn't give a fuck what Government costs, or who has to pay for it, as long as it is SOMEONE ELSE. Maybe it's The Rich, maybe its Evil Corporations, maybe its our descendants, and maybe our public sector debts will simply go away by some sort of economic magic. This is apparently the common belief in Greece, Spain, Italy, and Portugal. We don't know and we don't care.
We have universalized and collectivized irresponsibility. If that's not a "decline," then I don't know what is.
Re: Why we're in the state we're in
Ronald Reagan ran for office on the idea that deficits are wicked and then exploded the debt to levels never seen before.
Nixon had huge deficits which he left to Jerry Ford to explain.
And now we're two generations ago and your argument, is hogwash.
Go pull the other one. You never actually check facts, do you?
yrs,
rubato
Nixon had huge deficits which he left to Jerry Ford to explain.
And now we're two generations ago and your argument, is hogwash.
Go pull the other one. You never actually check facts, do you?
yrs,
rubato
Re: Why we're in the state we're in
"Ronald Reagan...exploded the debt."
That about covers it. No need to read any further.
That about covers it. No need to read any further.
-
Econoline

- Posts: 9607
- Joined: Sun Apr 18, 2010 6:25 pm
- Location: DeKalb, Illinois...out amidst the corn, soybeans, and Republicans
Re: Why we're in the state we're in
U.S. national debt as of 12/31/1976.......$718,943,000,000dgs49 wrote:"Ronald Reagan...exploded the debt."
That about covers it. No need to read any further.
U.S. national debt as of 12/31/1980.......$930,210,000,000 (42% increase under Carter)
U.S. national debt as of 12/31/1988.....$2,684,392,000,000 (189% increase under Reagan)
U.S. national debt as of 12/31/1992.....$4,177,009,000,000 (55.6% increase under GHWBush)
U.S. national debt as of 12/31/2000.....$5,662,216,013,697 (36% increase under Clinton)
U.S. national debt as of 12/31/2008....$10,699,804,864,612 (89% increase under GWBush)
U.S. national debt as of 12/31/2011....$15,125,898,976,397 (41% increase under Obama, so far)
source
People who are wrong are just as sure they're right as people who are right. The only difference is, they're wrong.
— God @The Tweet of God
— God @The Tweet of God

Re: Why we're in the state we're in

While Mr. Reagan could certainly have done a better job holding down federal spending, that fact is that even though he also came into office inheriting a major economic cluster fuck from his predecessor that took a couple of years to work out, his polices resulted in much higher government revenue and lower cost of government as a percentage of GDP, (which is what really matters) than the policies of the current incumbent have.


-
Econoline
- Posts: 9607
- Joined: Sun Apr 18, 2010 6:25 pm
- Location: DeKalb, Illinois...out amidst the corn, soybeans, and Republicans
Re: Why we're in the state we're in
Oh, I'm sorry, I didn't realize I needed to include a graph; I thought the words and numbers would be sufficient for everyone except rubato. 
Oh well...here you go:
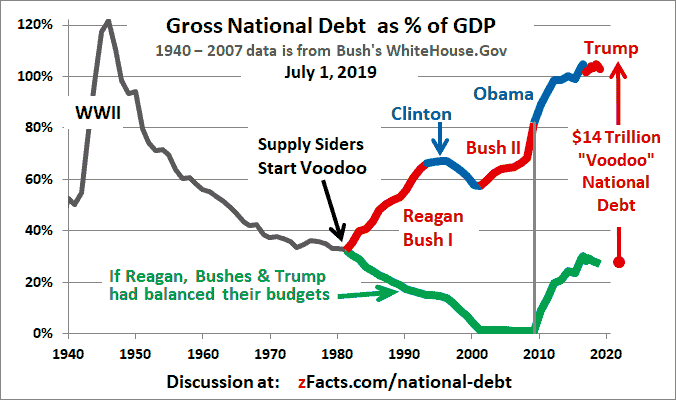
Oh, and BTW...a big part of the reason "[Reagan's] polices resulted in much higher government revenue" is that he raised taxes.
Oh well...here you go:
Oh, and BTW...a big part of the reason "[Reagan's] polices resulted in much higher government revenue" is that he raised taxes.
People who are wrong are just as sure they're right as people who are right. The only difference is, they're wrong.
— God @The Tweet of God
— God @The Tweet of God
Re: Why we're in the state we're in
I posted that chart because it was the first thing I came across when I was searching for info that would demonstrate how misleading the numbers you posted were...
Not exactly...(or even approximately)
(This is a long read detailing the affects of tax cuts and increases going back to JFK. If you follow the link at the end you will find live links to back up the stats, if you think the author was making them up... there are no graphs; I'm hoping the words and numbers will be sufficient:)
Well, uh, no....Oh, and BTW...a big part of the reason "[Reagan's] polices resulted in much higher government revenue" is that he raised taxes.
Not exactly...(or even approximately)
(This is a long read detailing the affects of tax cuts and increases going back to JFK. If you follow the link at the end you will find live links to back up the stats, if you think the author was making them up... there are no graphs; I'm hoping the words and numbers will be sufficient:)
http://www.mtgriffith.com/web_documents/taxcutfacts.htm
The Facts About Tax Cuts, Revenue, and Growth
Michael T. Griffith
In every case over the last 60 years, major tax cuts have more than paid for themselves. In fact, every major tax cut since JFK has been followed by substantial increases in revenue, not to mention solid economic growth. Moreover, total federal revenue rose at a faster rate after each of those tax cuts than it did before them. Anyone can confirm these basic facts for themselves by checking federal budget data and economic indicators before and after major tax cuts (see, for example, Federal Budget Data, Data 360 Unemployment U.S., and Total Economy Database). Let’s take a closer look at the results of the last four major tax cuts (and then for good measure we’ll examine the Mellon tax cuts of the 1920s).
Bush Tax Cuts: President George W. Bush’s 2003 tax cuts generated a massive increase in federal tax revenue and were followed by 52 consecutive months of economic growth. From 2004 to 2007, federal tax revenue increased by $780 billion, the largest four-year increase in American history. Total federal revenue from 2003 to 2007:
2003 -- $1.78 trillion
2004 -- $1.88 trillion
2005 -- $2.15 trillion
2006 -- $2.40 trillion
2007 -- $2.56 trillion
Total federal revenue for 2008 dropped slightly, down to $2.52 trillion, because a recession started that year, but revenue was still substantially higher than it was in 2003 or 2004. During the same period, income tax revenue rose dramatically, going from $925 billion in 2003 to $1.53 trillion in 2007. As with other types of federal revenue, income tax revenue dropped slightly in 2008, down to $1.45 trillion, due to the fact that a recession began that year.
It’s important to keep in mind that the recession had nothing to do with the tax cuts. The recession was brought on by destructive federal intervention in the subprime mortgage market, irresponsible funding and securitization of subprime loans by Freddie Mac and Fannie Mae, unsound Federal Reserve monetary policy, a lack of oversight by the Securities and Exchange Commission, greed and fraud committed by certain large banks and investment firms, and consumers who bought homes they really couldn’t afford. Furthermore, even in 2009, when the recession neared depression territory and remained severe throughout the year, total federal revenue was $2.10 trillion, which, even adjusted for inflation, was very close to total federal revenue for the boom years of 2005 and 2006.
What's more, after the 2003 tax cuts, the rich paid a higher percentage of the total tax burden than they had at any time in the previous 40 years. This shocked the New York Times, whose astonished editorial board could only describe the gains as a "surprise windfall." This was also true with regard to income taxes. For example, after the Bush tax cuts, the top 1% paid a larger share of all federal income taxes than before. In 2007 the top 1% of taxpayers earned 22.8% of the nation's income, yet paid 40.4% of all federal income taxes, whereas in 2004 the top 1% paid 36.89% of all federal income taxes. So the percentage of income taxes paid by the top 1% went from 36.89% in 2004 to 40.4% in 2007. (Incidentally, this also means that in 2007 the top 1% paid more in federal income taxes than the bottom 95% paid.)
Interestingly, total federal revenue grew at a faster rate during the three years following the Bush tax cuts than it did during the three Clinton boom years of 1998-2000. From 1998 to 2000, following Bill Clinton’s 1997 tax cuts, total federal revenue rose $300 billion, from $1.72 trillion to $2.02 trillion, an increase of 17%. A very respectable, solid increase. But, from 2004 to 2006, total federal revenue rose a whopping $520 billion, from $1.88 trillion to $2.40 trillion, an increase of 27%. The rate of inflation for the two periods was very similar (2.55% vs. 2.98%). So, even adjusted for inflation, the revenue growth that followed Bush’s tax cuts was considerably better than the revenue growth that occurred during the three most prosperous years of Clinton’s presidency.
As for economic growth under Bush, the Wall Street Journal pointed out the following in September 2008:
U.S. output has expanded faster than in most advanced economies since 2000. The IMF reports that real U.S. gross domestic product (GDP) grew at an average annual rate of 2.2% over the period 2001-2008 (including its forecast for the current year). President Bush will leave to his successor an economy 19% larger than the one he inherited from President Clinton. This U.S. expansion compares with 14% by France, 13% by Japan and just 8% by Italy and Germany over the same period.
The latest ICP findings, published by the World Bank in its World Development Indicators 2008, also show that GDP per capita in the U.S. reached $41,813 (in purchasing power parity dollars) in 2005. This was a third higher than the United Kingdom's, 37% above Germany's and 38% more than Japan's. (http://online.wsj.com/article/SB122039890722392873.html)
Critics claim that the growth during the Bush years was merely the result of the housing bubble and wild consumer spending. James Pethokoukis responded to this claim in a January 2009 article in U.S. News & World Report:
"Economy Made Few Gains in Bush Years", declared the Washington Post earlier this week. And while the story grudgingly acknowledged the 52 straight months of job growth, it dismissed any economic gains as the ephemeral product of the housing bubble and wild-spending consumers. Except . . . that worker productivity -- the most important long-term indicator of the core health and competitiveness of an economy -- has risen at a really impressive 2.6 annual rate during the Bush years vs. 2.0 percent for Clinton and 1.6 percent for Reagan. . . . This is important stuff. It's one big reason why the World Economic Forum says the U.S. has the most competitive economy in the world. The economic rebound after the pro-growth 2003 tax cuts was no mirage . . .
Bush's successes are destined to be overshadowed by the imploding housing and credit bubbles. They are the economic equivalents of IEDs, and they blew up at the end of his second term. The causes? Everything from Fed monetary policy to government housing policy to cultural dysfunction on Wall Street and Main Street. But as teenagers like to say, "Too bad, so sad." Bush was president, and Big Media has already declared its summary judgment: Failure. Reaching such a mistaken conclusion, though, requires an almost purposeful misreading of the past eight years. (http://www.usnews.com/money/blogs/capit ... ecord.html)
Whatever problems there were with Bush’s economic policies, his tax cuts were not among them.
Clinton Tax Cuts: In 1997 President Bill Clinton signed a tax cut bill that, among other things, created a new $500 child tax credit, raised the income limit for deductible IRAs, nearly doubled the estate tax exemption, and slashed the capital gains tax rate by a whopping 28%. The reduction in the capital gains tax was especially helpful. In 1995, just over $8 billion in venture capital was invested. By 1998, the first full year in which the lower capital gains rates were in effect, venture capital activity reached almost $28 billion, more than a three-fold increase over 1995 levels, and it doubled again in 1999. At the same time, total federal revenue rose every year after the 1997 tax cuts.
In addition, it’s worth noting that total federal revenue grew at a slightly faster rate in the three years after the 1997 tax cuts than it did in the three years before them. From 1994 to 1996, total federal revenue grew by $200 billion, from $1.26 trillion to $1.45 trillion, an increase of 16%. From 1998 to 2000, total federal revenue grew by $300 billion, from $1.72 trillion to $2.02 trillion, an increase of 17%.
Moreover, although the economy was doing respectably well in the four years before the 1997 tax cuts, it did considerably better after the tax cuts. For example, from 1993 to 1996, the economy grew at an annual rate of 3.2%, but the annual growth rate jumped to 4.2% after the tax cuts (both rates are adjusted for inflation). In the four years before the tax cuts, the rate of real wage growth was only 0.8%, but it rose to 6.5% after the tax cuts. Dr. J. D. Foster:
The Clinton years present two consecutive periods as experiments of the effects of tax policy. The first period, from 1993 to 1996, began with a significant tax increase as the economy was accelerating out of recession. The second period, from 1997 to 2000, began with a modest tax cut as the economy should have settled into a normal growth period. The economy was decidedly stronger following the tax cut than it was following the tax increase. . . .
The economy averaged 4.2 percent real growth per year from 1997 to 2000--a full percentage point higher than during the expansion following the 1993 tax hike. Employment increased by another 11.5 million jobs, which is roughly comparable to the job growth in the preceding four-year period. Real wages, however, grew at 6.5 percent, which is much stronger than the 0.8 percent growth of the preceding period (illustrated in the graph below). Finally, total market capitalization of the S&P 500 rose an astounding 95 percent. . .
In summary, coming out of a recession into a period when the economy should grow relatively rapidly, President Clinton signed a major tax increase. The average growth rate over his first term was a solid 3.2 percent. In 1997, at a time when the expansion was well along and economic growth should have slowed, Congress passed a modest net tax cut. The economy grew by a full percentage point-per-year faster over his second term than over Clinton's first term. (http://www.heritage.org/Research/Report ... 1990s-Boom)
There can be no denying that overall Clinton compiled a good economic record, but some important points need to be made about that record. Rich Lowry:
The deficit reached its 1990s high of $290 billion in fiscal year 1992 and fell to $255 billion in fiscal year 1993, a roughly $40 billion reduction even before Clinton got started. Why was the deficit already declining? The deficit tends to rise during recessions, and fall during expansions. It climbed with the recession of 1990-91, before declining again as the recovery took hold. So, just as Clinton was taking office, natural forces were already working to reduce the deficit. . . .
As for economic growth, the fact is that the economy was already growing before any Clinton policies took effect. In 1992, growth was 3 percent. From 1993 to 1995 it was 3.1 percent annually. In other words, steady as she goes.
Now, later in the decade, the economy did indeed take off in a marvelous boom. This was a result of the corporate restructuring and downsizing of the 1980s and early 1990s, and the fantastic rise of new technology. You cannot attribute all this to the Clinton administration, unless you really do think that Al Gore invented the Internet.
Where Clinton should get credit is basically for getting out of the way of the free market: He . . . let Alan Greenspan keep inflation in check; he signed a "tax cut for the rich" in 1997; he signed various deregulatory bills; and his administration adopted a hands-off policy for the Internet (crafted by, of all people, former health-care guru Ira Magaziner). (http://old.nationalreview.com/lowry/low ... 151115.asp)
That being said, the Clinton economic record is impressive by almost any measurement. A White House report discussed the economy‘s performance under Clinton as of November 2000 (just two months before he left office):
Strong Economic Growth: Since President Clinton took office, economic growth has averaged 4.0 percent per year, compared to average growth of 2.8 percent during the Reagan-Bush years. The economy has grown for 116 consecutive months, the most in history.
Most New Jobs Ever Created Under a Single Administration: The economy has created more than 22.5 million jobs in less than eight years—the most jobs ever created under a single administration, and more than were created in the previous 12 years. Of the total new jobs, 20.7 million, or 92 percent, are in the private sector.
Median Family Income Up $6,000 since 1993: Economic gains have been made across the spectrum as family incomes increased for all Americans. Since 1993, real median family income has increased by $6,338, from $42,612 in 1993 to $48,950 in 1999 (in 1999 dollars).
Unemployment at Its Lowest Level in More than 30 Years: Overall unemployment has dropped to the lowest level in more than 30 years, down from 6.9 percent in 1993 to just 4.0 percent in November 2000. The unemployment rate has been below 5 percent for 40 consecutive months. Unemployment for African Americans has fallen from 14.2 percent in 1992 to 7.3 percent in October 2000, the lowest rate on record. Unemployment for Hispanics has fallen from 11.8 percent in October 1992 to 5.0 percent in October 2000, also the lowest rate on record. (http://clinton5.nara.gov/WH/Accomplishm ... rs-03.html)
Democrat Al From of the Democratic Leadership Council made some interesting points as he compared the economic records of Clinton and Reagan with the economic record of George H. W. Bush (i.e., Bush I or Bush Sr.) in a 2002 article:
On average, 2.65 million new private sector jobs were created every year during the Clinton Presidency. That's an average annual increase of 2.7 percent. Next best were the Reagan years, with an average of 2.34 million new private sector jobs created each year -- a 2.2 percent increase.
The Bush presidency lagged far behind Clinton's and Reagan's. During the elder Bush's term, an average of 355,000 jobs were created in each of his four years, increasing the number of available jobs by only 0.4 percent. . . .
Not surprisingly Clinton and Reagan had the best records of reducing unemployment, too. Interestingly, both began their terms with the unemployment rate over seven percent -- Clinton at 7.4 percent and Reagan at 7.2 percent. Both reduced unemployment substantially -- Clinton to 4.0 percent and Reagan to 5.3 percent. . . .
Family income, too, rose rapidly during both the Clinton and Reagan terms. In 2000 dollars, incomes increased nearly 23 percent from just over $53,000 a year at the end of the George H. W. Bush Administration to more than $65,000 a year when Clinton left office. In the Reagan years, family incomes (again in 2000 dollars) rose nearly 15 percent from about $47,000 annually to over $54,000. During Bush I, family incomes actually fell.
President Clinton was the only recent President to preside over a substantial drop in child poverty -- from nearly 23 percent to 16.2 percent. The proportion of children living in poverty was just about the same at the end of the Reagan years -- 19.5 percent -- as at the beginning -- 20 percent. . . . Child poverty actually rose during the Bush I term, from 19.5 percent to 22.3 percent of children. (http://www.dlc.org/ndol_ci.cfm?contenti ... &subid=305)
Reagan Tax Cuts: In 1994 President Clinton's own Council of Economic Advisers stated: "It is undeniable that the sharp reduction in taxes in the early 1980s was a strong impetus to economic growth."
The Reagan tax cuts were followed by a sharp increase in revenue. Total federal revenue, including income tax revenue, rose every year from 1983 to 1988, after a dip in 1982 (due at least in part to the recession of that year--the recession began in December 1980 and ended in November 1982). From 1982 to 1989, i.e., when Reagan budgets were in operation, total federal revenue rose from $618 billion to $991 billion. (And herein by “in operation” I mean in effect for at least 10 months of a given year.)
Let's look at what happened to federal income tax revenue under Reagan from 1983 to 1989, bearing in mind that Reagan slashed income tax rates across the board:
1983 -- $326 billion
1984 -- $355 billion
1985 -- $396 billion
1986 -- $412 billion
1987 -- $476 billion
1988 -- $496 billion
1989 -- $549 billion
Critics point out that Reagan also signed two tax increases. However, the fact remains that the total tax burden was far, far lower when Reagan left office than when he took office. In other words, even counting the two tax increases that Reagan signed, taxes overall were still much lower in Reagan’s last year than they were in his first year. For example, when Reagan became president in January 1981, the top marginal tax rate was 70%--yes, 70%--but by the last month of his presidency in January 1989, it was 28%.
As a result of the Reagan tax cuts, tax payments and the share of income taxes paid by the top 1% climbed sharply. For example, in 1981 the top 1% paid 17.6% of all personal income taxes, but by 1988 their share had jumped to 27.5%, a 10 percentage point increase. The share of the income tax burden borne by the top 10% of taxpayers increased from 48.0% in 1981 to 57.2% in 1988. Meanwhile, the share of income taxes paid by the bottom 50% of taxpayers dropped from 7.5% in 1981 to 5.7% in 1988.
It’s interesting to consider income tax revenue under Jimmy Carter, Reagan’s predecessor, in contrast to income tax revenue under Reagan. During the four years in which Carter’s budgets were in operation, income tax revenue rose $106 billion, from $241 billion in 1978 to $347 billion in 1981, an increase of 44%. However, total inflation for fiscal years 1978-1981 (i.e., October 1978 to October 1981) was 51.62% (an average of 12.7% per year). (Inflation from January 1978 to December 1981 totaled 50.40%.) During Reagan’s eight budget years, income tax revenue rose $202 billion, from $347 in 1982 billion to $549 billion in 1989, an increase of 58%, and total inflation during fiscal years 1982-1989 was only 34.48% (an average of 4.3% per year). (Inflation from January 1982 to December 1989 totaled 33.72%.) Thus, income tax revenue grew at a faster rate under Reagan than it did under Carter, both in raw percentage and adjusted for inflation.
When we look at the growth of total federal revenue under Reagan and Carter, a similar picture emerges. During the Carter budget years, total federal revenue rose by $199 billion, from $400 billion in 1977 to $599 billion in 1981, an increase of 50%. However, during the Reagan budget years, total federal revenue rose by $373 billion, from $618 billion in 1982 to $991 billion in 1989, an increase of 60%. Furthermore, as mentioned, counting only calendar years, inflation totaled 50.40% under Carter vs. 33.72% under Reagan (total inflation during their respective fiscal years was even worse for Carter: 51.62% vs. 34.48%).
The economy grew impressively during Reagan’s presidency. The economic expansion of the Reagan years is particularly impressive when we remember that Reagan inherited a weak and staggering economy. In January 1981 the unemployment rate was 7.4% and was on its way to climbing to over 10%. Double-digit inflation had pushed interest rates into the high double-digit range. Real pre-tax income of the average American family had been dropping since 1976, and after-tax income was falling even faster. With these facts in mind, the Reagan economic record seems especially praiseworthy. Economists William Niskanen and Stephen Moore:
· Real economic growth averaged 3.2 percent during the Reagan years versus 2.8 percent during the Ford-Carter years and 2.1 percent during the Bush-Clinton years.
· Real median family income grew by $4,000 during the Reagan period after experiencing no growth in the pre-Reagan years; it experienced a loss of almost $1,500 in the post-Reagan years.
· Interest rates, inflation, and unemployment fell faster under Reagan than they did immediately before or after his presidency. (http://www.cato.org/pub_display.php?pub_id=1120&full=1)
Dr. Peter B. Sperry:
Despite the steep recession in 1982--brought on by tight money policies that were instituted to squeeze out the historic inflation level of the late 1970s--by 1983, the Reagan policies of reducing taxes, regulation, and inflation were in place. The result was unprecedented economic growth:
This economic boom lasted 92 months without a recession, from November 1982 to July 1990, the longest period of sustained growth during peacetime and the second-longest period of sustained growth in U.S. history. The growth in the economy lasted more than twice as long as the average period of expansions since World War II.
The American economy grew by about one-third in real inflation-adjusted terms. This was the equivalent of adding the entire economy of East and West Germany or two-thirds of Japan's economy to the U.S. economy. (http://www.heritage.org/research/taxes/bg1414.cfm)
Dr. Niskanen:
Real GDP per working-age adult, which had increased at only a 0.8 annual rate during the Carter administration, increased at a 1.8 percent rate during the Reagan administration. The increase in productivity growth was even higher: output per hour in the business sector, which had been roughly constant in the Carter years, increased at a 1.4 percent rate in the Reagan years. Productivity in the manufacturing sector increased at a 3.8 percent annual rate, a record for peacetime.
Most other economic conditions also improved. The unemployment rate declined from 7.0 percent in 1980 to 5.4 percent in 1988. The inflation rate declined from 10.4 percent in 1980 to 4.2 percent in 1988. (http://www.econlib.org/library/Enc1/Reaganomics.html)
Economist Larry Kudlow:
Immediately upon assuming office, he reversed the economic policy of the decline years. He brought down marginal tax rates, restoring the incentives necessary for economic growth. He gave Federal Reserve chairman Paul Volcker the strong ground to stand on, allowing him to harden the value of the dollar and slay inflation.
At bottom, what became known as Reaganomics was a new pro-growth policy mix of tax incentives at the margin and stable money. But there was more. . . . He deregulated oil prices, proving the conventional wisdom wrong as energy became much cheaper. . . . He created individual retirement accounts and 401k accounts, giving birth to the investor class. . . .
By 1986, Reagan’s tax-reform plan left two marginal rates of 28 percent and 15 percent, a long stone’s throw from the 70 percent top rate he had inherited. His plan also cut about 2,000 pages from the tax code. . . .
Between 1982 and 1989, the economy grew, adjusting for inflation, by 35 percent: more than 4.5 percent per year. As growth was restored, tax revenues came flowing in. Income-tax revenues grew even as tax rates dropped. By 1986, the inflation rate had fallen to 1 percent. By the end of his term, unemployment had dropped to 5.5 percent. Interest rates had plunged. The stock market had soared.
From July 1982 through the end of 1988, the S&P 500 averaged a near 21 percent annual gain. Brand-new industries arose in computing, software, communications, and the Internet — original endeavors that completely streamlined and transformed the American economy for the decades to come. (http://old.nationalreview.com/kudlow/ku ... 100915.asp)
JFK Tax Cuts: President John F. Kennedy's tax cuts were the biggest of the modern tax cuts. The Tax Foundation explains:
Contrasting the size of the tax cuts with national income shows that the Kennedy tax cut, representing 1.9% of income, was the single largest first-year tax-cut of the post-WW II era. The Reagan tax cuts represented 1.4% of income while none of the Bush tax cut even breaks 1% of income. The Kennedy tax cuts would only have been surpassed in size by combining all three Bush tax cuts into a single package.
Comparing the size of these tax cuts with the federal budget shows that Kennedy’s tax cuts represented 8.8% of the budget. In 1981, Reagan’s tax cuts represented 5.3% of the budget. Each of Bush’s tax cuts are smaller than Reagan’s—EGTRRA (3.8%), JCWA (2.5%) and the 2003 Tax Cut (1.8%). When the Bush tax cuts are combined (8.1%), they would be larger than Reagan’s tax cut, yet smaller than Kennedy’s tax cut. ("Fiscal Facts," http://www.taxfoundation.org/news/show/323.html)
The result? JFK’s tax cuts were passed in the summer of 1964. From 1965 to 1968, total federal revenue rose by an impressive 30%, from $117 billion to $153. Some argue that 1968 should be omitted from such calculations, since a tax increase was passed that year. However, the 1968 tax increase (The Revenue and Expenditure Control Act) was not passed until June of that year, so for at least half of 1968 the JFK tax rates were still in effect. In any event, if we omit 1968, we still get a very impressive revenue growth rate: From 1965 to 1967, total federal revenue rose by 27%, from $113 to $149 billion Moreover, if we compare revenue growth from 1961-1964 to 1965-1967, we find that revenue rose more rapidly in the latter period: From 1961 to 1964 revenue grew by 12% ($101 billion to $113 billion), but from 1965 to 1967 revenue grew by 27% ($117 billion to $149 billion): So the rate of revenue growth more than doubled after the tax cuts were passed.
Looking at revenue growth in relation to inflation from JFK's first year to the last year his tax rates were in effect, i.e., 1961 to 1968. we see the following: From 1961 to 1968, total federal revenue rose from $101 billion in 1961 to $153 billion in 1968, an increase of 52%, for an average growth rate of 6.5% per year. Total inflation for that period was only 19.13%, an average of only 2.4% per year. From 1961 to 1967, total federal revenue rose from $101 billion to $149 billion, an increase of 48%, for an average growth rate of 6% per year. Total inflation for those years was only 13.76%, an average of only 1.96% per year.
Additionally, JFK’s tax cuts led to the rich paying a larger share of income taxes:
Just as happened in the 1920s, the share of the income tax burden borne by the rich increased following the tax cuts. Tax collections from those making over $50,000 per year climbed by 57 percent between 1963 and 1966, while tax collections from those earning below $50,000 rose 11 percent. As a result, the rich saw their portion of the income tax burden climb from 11.6 percent to 15.1 percent. (http://www.heritage.org/research/taxes/wm327.cfm)
The Kennedy tax cuts were followed by solid economic growth. Economist Richard Rahn:
President Kennedy proposed major tax reduction before he was assassinated in 1963. Congress passed and President Johnson signed the tax cuts in the summer of 1964. Rates for all income groups were cut and the top rate was reduced from 91 percent to 70 percent. Economic growth averaged more than 5 percent a year for the three years after the tax cut, with very low inflation. President Johnson and the Democratic Congress raised taxes in 1968, ending the Kennedy experiment. (http://www.discovery.org/a/3713)
President Kennedy understood that tax cuts actually increase revenue, spark growth, and can actually lower deficits:
Our true choice is not between tax reduction, on the one hand, and the avoidance of large federal deficits on the other. It is increasingly clear that no matter what party is in power, so long as our national security needs keep rising, an economy hampered by restrictive tax rates will never produce enough revenue to balance our budget — just as it will never produce enough jobs or enough profits. . . .
In short, it is a paradoxical truth that tax rates are too high today and tax revenues are too low and the soundest way to raise the revenue in the long run is to cut the rates now. The experience of a number of European countries and Japan have borne this out. This country's own experience with tax reduction in 1954 has borne this out. And the reason is that only full employment can balance the budget, and tax reduction can pave the way to that employment. The purpose of cutting taxes now is not to incur a budget deficit, but to achieve the more prosperous, expanding economy which can bring a budget surplus. (http://www.americanrhetoric.com/speeche ... dress.html)
Many liberal commentators argue that tax cuts have caused budget deficits. This is an erroneous argument. As we’ve seen, every major tax cut since JFK has been followed by a large increase in revenue. The problem has been that government spending has usually risen even more than revenue has risen. Furthermore, after JFK’s tax cuts were passed in 1964, the deficit was very small, even though Congress and President Lyndon Johnson went on a spending spree and increased spending by 24%. From 1965 to 1967, the deficit averaged less than 1% of GDP (0.57%). When Bill Clinton and the Republican-controlled Congress held spending below revenue from 1997 to 2000, an amazing thing happened—we balanced the budget, started running a surplus, and began paying down the national debt. Similarly, when President Harding not only held spending below revenue but actually cut spending, we balanced the budget, ran a surplus for several years, and began paying down the national debt. Deficits have never been caused by tax cuts but by excessive government spending.

Re: Why we're in the state we're in
This part at least is a complete crock.He deregulated oil prices, proving the conventional wisdom wrong as energy became much cheaper. . . . He created individual retirement accounts and 401k accounts, giving birth to the investor class. . . .
linkThe Jimmy Carter administration began a phased deregulation of oil prices on April 5, 1979
linkIndividual retirement arrangements were introduced in 1974 with the enactment of the Employee Retirement Income Security Act (ERISA).
linkThe Revenue Act of 1978 included a provision that became Internal Revenue Code (IRC) Sec. 401(k) (for which the plans are named), under which employees are not taxed on the portion of income they elect to receive as deferred compensation rather than as direct cash payments.
With three complete fabrications within two lines, I somehow doubt that the remainder of the piece is a paragon of accuracy.
"When a man has so far corrupted and prostituted the chastity of his mind, as to subscribe his professional belief to things he does not believe, he has prepared himself for the commission of every other crime."
-- Thomas Paine
-- Thomas Paine
Re: Why we're in the state we're in
Anyone who cared about the truth would already know it was bullshit.
"Lie all the time about everything" is the Republican mantra. It works on the credulous and stupid.
Republican policies created the worst collapse in 80 years. And none of them are honest enough to tell us what they have learned that they won't do again.
yrs,
rubato
"Lie all the time about everything" is the Republican mantra. It works on the credulous and stupid.
Republican policies created the worst collapse in 80 years. And none of them are honest enough to tell us what they have learned that they won't do again.
yrs,
rubato
Re: Why we're in the state we're in
Which of those statistics do you find to be false rube? You have different sources with different numbers on growth?
But of course you don't, which why you chant your mindless mantra.
Mindless mantra chanting is your stock in trade; it's pretty much all you ever offer here.
But of course you don't, which why you chant your mindless mantra.
Mindless mantra chanting is your stock in trade; it's pretty much all you ever offer here.