How do you Rate in the Geography of Hate
Posted: Fri May 17, 2013 2:28 pm
Hey kids!! Let's click on the Geographic Hate Map!
Geotagging shows where the haters are
By jennifer-wadsworth@blog.timesunion.com (Jennifer Wadsworth)
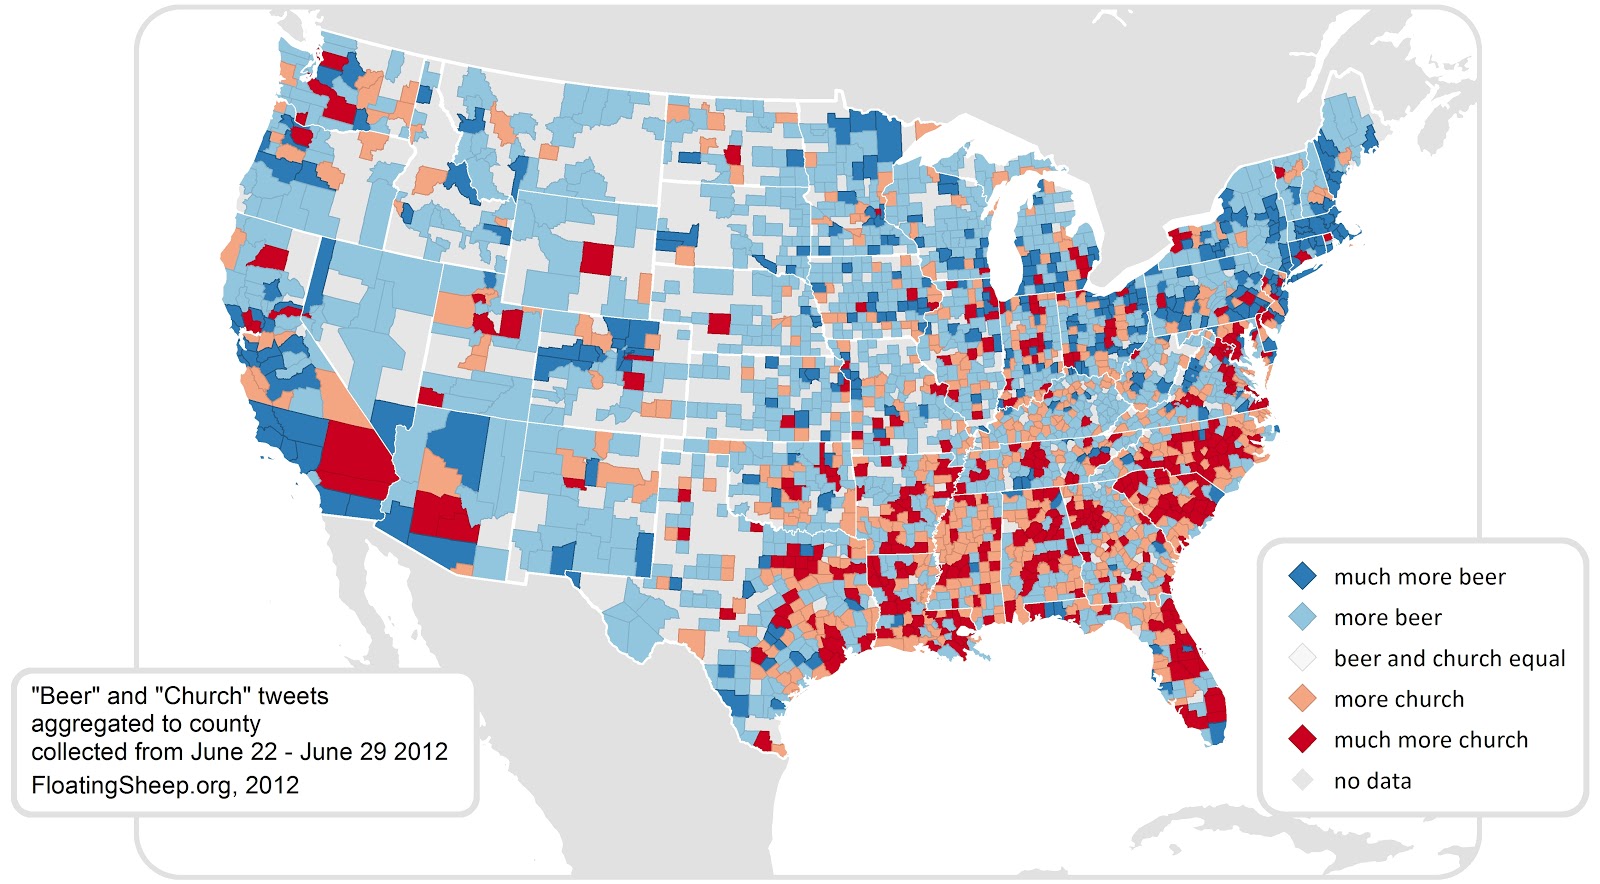
A group of academics, adorably and somewhat mysteriously dubbed Floating Sheep, came out with a study called “Geography of Hate,” a color-coded image that maps out racist, homophobic and anti-disability tweets.
California’s Humboldt State University helped the group analyze geotagged tweets, manually reading through 150,000 containing some kind of slur (read individually to determine if the context was, indeed, mean-spirited). They then figured the ratio of offensive posts compared to overall tweets in the country.
“Hateful tweets were aggregated to the county level and then normalized by the total number of tweets in each county,” the group writes in a detailed explanation of the study. “This then shows a comparison of places with disproportionately high amounts of a particular hate word relative to all tweeting activity.”
Most of the hate-spewing had to do with race, using disparaging terms for Latinos, blacks and some Asians. Next highest number were homophobic tweets. And posts about the handicapped used the word “cripple.” If you want to see the terms used (warning: highly offensive language) and the frequency by region, click here to view the interactive map.
Before we start harping on the right side of the country (and parts of Idaho and California east of Sacramento), though, consider another study, this one with a more global outlook. Despite their penchant for less-than-savory 140-character-or-less rants, Americans overall are among the most tolerant people in the world, according to some Swedish researchers.
A survey of 80 countries found Western nations, including United Kingdom, Canada, Australia and, yes, the U.S., are the most accepting. Hong Kong, Jordan and Bangladesh, conversely, were named the least tolerant.
Basically, the survey says, economically free nations tend to be more accepting.
The World Value Survey asked people who they’d refuse to live next to. The countries with the highest number of respondents citing “people of a different race” were named least tolerant. Justifiably so.
Nearly 72 percent of Hong Kong residents surveyed said they refused to live next to someone of another race. In the U.S., less than 4 percent said the same.
“Europe is remarkably split – the west of the continent is generally more tolerant than the east, but France is a striking outlier with 22.7 percent of the French rejecting neighborhood diversity,” the Daily Mail writes.
Americans may mouth off like a bunch of racist nuts online, but at least they’re generally better about actually co-existing than other places.
source
Is cripple really a hateful term?

