
Illegal migrants see the UK as a "soft touch" and its benefits system acts as a "magnet" to them, the mayor of the French city of Calais has told MPs.
Natacha Bouchart added that the fences placed around UK border controls set up in the city "make everybody laugh".
"These people are ready and prepared to die to come to England," she told the Home Affairs Committee.
Calais has struggled in recent months with increasing numbers of migrants arriving and trying to get to the UK.
Prime Minister David Cameron has urged "action right across the board" and "full-hearted cooperation between the British and French authorities to make sure we can stop people getting on to trains, getting on to container lorries or other vehicles and coming across the Channel".
His official spokeswoman said the government's focus was to study "pull factors and address them." Migrants now have to wait three months before claiming Jobseeker's Allowance and can only receive it for six months, she added.
French police used tear gas this week as hundreds of migrants tried to climb on to trucks bound for the UK.
Ms Bouchart estimated that 2,500 illegal immigrants were now living in Calais and that most were Eritrean, Ethiopian, Sudanese, Syrian, Egyptian, Lebanese, Iranian and Iraqi.
Calais was suffering problems from "a lot of mafia and traffickers in this population", Ms Bouchart said.
She added: "There hasn't been a message from the British government or anywhere else that it's not El Dorado."
Asked by the committee's chairman, Labour MP Keith Vaz whether the UK was seen as "a soft touch for those that want to come here", she replied: "Oui."
'Favourable regime'
Ms Bouchart, speaking via an interpreter, added: "You have a much more favourable regime in Britain than other countries. The second thing is the entitlement to benefits of £36 which are given to asylum seekers or migrants, which is a huge amount for people who have nothing in their lives."
Ms Bouchart said the "real magnet is the benefits that are perceived in Great Britain".
The official UK border was moved to France in 2003 in an effort to stop illegal immigrants reaching British soil to claim asylum.
'Adversely affected'
This was recently reinforced with fencing previously used for security at a Nato conference. But Ms Bouchart said: "The fence makes everybody laugh."
Some 7,500 migrants have been arrested in Calais this year. The UK has agreed to contribute £12m (15m euros; $19m) to help manage the situation.
UKIP said it had sympathy with Ms Bouchart at having to deal with the disturbances in Calais but the UK needed to send a message that "its streets are not paved with gold".
"From her experience it is evident that even though Britain has not signed the Schengen Agreement, this country is adversely affected by the lack of European and French action on migration," said the party's immigration spokesman MEP Steven Woolfe.
"However, the problem she highlights is not one of the British welfare system, but of the way in which it can be misused.
"Welfare in the UK should be there for our own citizens, who have paid in, or whose family have paid in. It is not something for anybody turning up at our borders to be able to access."
The benefits that EU migrants can claim in another EU country vary across the 28-nation bloc but certain basic rules are enshrined in EU law.
The UK does not rank highest in terms of total spending on social security per inhabitant.
According to the EU statistics agency Eurostat, the UK spent nearly £6,660 (8,000 euros) in 2010, with France, Germany, Denmark and the Netherlands all spending more than 9,000 euros.
At the other end of the scale, spending in Bulgaria and Romania was below 2,000 euros.
In the UK, a bigger portion of welfare is funded by the state than is the case in Poland, France, Germany or the Netherlands. In those countries, more is funded from individual and employer contributions with benefits more closely linked to previous earnings.
On the other hand, in several countries, including the Republic of Ireland, Sweden and Denmark, the share of state funding is higher than in the UK.
Benefits magnet
Benefits magnet

“If you trust in yourself, and believe in your dreams, and follow your star. . . you'll still get beaten by people who spent their time working hard and learning things and weren't so lazy.”

Re: Benefits magnet
You going to start quoting Ayn Rand?
Re: Benefits magnet
gob shrugged....

Re: Benefits magnet
And Gob thinks our system is screwed up???
“I ask no favor for my sex. All I ask of our brethren is that they take their feet off our necks.” ~ Ruth Bader Ginsburg, paraphrasing Sarah Moore Grimké

Re: Benefits magnet
There's another way to look at this...Calais has struggled in recent months with increasing numbers of migrants arriving and trying to get to the UK...
Perhaps these people are not so anxious to get into the UK as they are desperate to get out of France...


Re: Benefits magnet
It is so simple. All you have to do is make the country crappier and the inhabitants more miserable and no one will want to go there.
May I offer Mississippi and Alabama as examples?
yrs,
rubato
May I offer Mississippi and Alabama as examples?
yrs,
rubato
Re: Benefits magnet
List of U.S. states by population growth rate
From Wikipedia, the free encyclopedia
This article includes a list of U.S. states sorted by the percentage change in estimated population for the 39 month period from April 1, 2010 to July 1, 2013, the most recent estimates available from the United States Census Bureau.[1]
Rank
State
2013 estimate
2010 Census
Change
1 North Dakota 723,393 672,591 +7.55%
— District of Columbia 646,449 601,723 +7.43%
2 Texas 26,448,193 25,145,561 +5.18%
3 Utah 2,900,872 2,763,885 +4.96%
4 Colorado 5,268,367 5,029,196 +4.76%
5 Florida 19,552,860 18,801,310 +4.00%
6 South Dakota 844,877 814,180 +3.77%
7 Washington 6,971,406 6,724,540 +3.67%
8 Arizona 6,626,624 6,392,017 +3.67%
9 Alaska 735,132 710,231 +3.51%
10 Wyoming 582,658 563,626 +3.38%
11 Nevada 2,790,136 2,700,551 +3.32%
12 North Carolina 9,848,060 9,535,483 +3.28%
13 Virginia 8,260,405 8,001,024 +3.24%
14 South Carolina 4,774,839 4,625,364 +3.23%
15 Hawaii 1,404,054 1,360,301 +3.22%
16 Georgia 9,992,167 9,687,653 +3.14%
17 Delaware 925,749 897,934 +3.10%
18 California 38,332,521 37,253,956 +2.90%
19 Idaho 1,612,136 1,567,582 +2.84%
20 Maryland 5,928,814 5,773,552 +2.69%
21 Oklahoma 3,850,568 3,751,351 +2.64%
22 Montana 1,015,165 989,415 +2.60%
23 Oregon 3,930,065 3,831,074 +2.58%
— U.S. 50 States + DC 316,128,839 308,745,538 +2.39%
24 Tennessee 6,495,978 6,346,105 +2.36%
25 Nebraska 1,868,516 1,826,341 +2.31%
26 Massachusetts 6,692,824 6,547,629 +2.22%
27 Minnesota 5,420,380 5,303,925 +2.20%
28 Louisiana 4,625,470 4,533,372 +2.03%
29 Arkansas 2,959,373 2,915,918 +1.49%
30 Iowa 3,090,416 3,046,355 +1.45%
31 Kansas 2,893,957 2,853,118 +1.43%
32 New York 19,651,127 19,378,102 +1.41%
33 Indiana 6,570,902 6,483,802 +1.34%
34 Kentucky 4,395,295 4,339,367 +1.29%
35 New Mexico 2,085,287 2,059,179 +1.27%
36 New Jersey 8,899,339 8,791,894 +1.22%
37 Alabama 4,833,722 4,779,736 +1.13%
38 Wisconsin 5,742,713 5,686,986 +0.98%
39 Missouri 6,044,171 5,988,927 +0.92%
40 Mississippi 2,991,207 2,967,297 +0.81%
41 Connecticut 3,596,080 3,574,097 +0.62%
42 Pennsylvania 12,773,801 12,702,379 +0.56%
43 New Hampshire 1,323,459 1,316,470 +0.53%
44 Illinois 12,882,135 12,830,632 +0.40%
45 Ohio 11,570,808 11,536,504 +0.30%
46 Vermont 626,630 625,741 +0.14%
47 Michigan 9,895,622 9,883,640 +0.12%
48 West Virginia 1,854,304 1,852,994 +0.07%
49 Maine 1,328,302 1,328,361 0.00%
50 Rhode Island 1,051,511 1,052,567 −0.10%
— Puerto Rico 3,615,086 3,725,789 −2.97%
-
oldr_n_wsr
- Posts: 10838
- Joined: Sun Apr 18, 2010 1:59 am
Re: Benefits magnet
What does the change in population by state in the US have to do with the UK and it's border problem?
Re: Benefits magnet
It's rubato starting that, you don't expect him to be able to think.
“If you trust in yourself, and believe in your dreams, and follow your star. . . you'll still get beaten by people who spent their time working hard and learning things and weren't so lazy.”
Re: Benefits magnet
Indeed...Gob wrote:It's rubato starting that, you don't expect him to be able to think.
Hmmm...rubato wrote:It is so simple. All you have to do is make the country crappier and the inhabitants more miserable and no one will want to go there.
May I offer Mississippi and Alabama as examples?
yrs,
rubato
May I offer Illinois and Connecticut as examples?
(You're gonna love this post rube...it's chock-a-block with statistical data
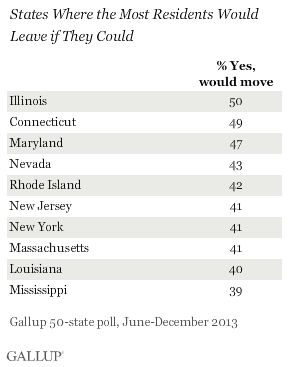
http://www.gallup.com/poll/168770/half- ... where.aspxHalf in Illinois and Connecticut Want to Move Elsewhere
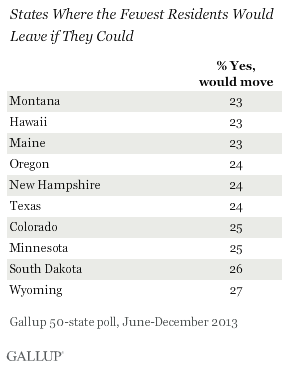
Montana, Hawaii, Maine boast lowest rate of residents wanting to leave
PRINCETON, NJ -- Every state has at least some residents who are looking for greener pastures, but nowhere is the desire to move more prevalent than in Illinois and Connecticut. In both of these states, about half of residents say that if given the chance to move to a different state, they would like to do so. Maryland is a close third, at 47%. By contrast, in Montana, Hawaii, and Maine, just 23% say they would like to relocate. Nearly as few -- 24% -- feel this way in Oregon, New Hampshire, and Texas.
Well, maybe it's my bad eyesight, but I'm seein' a fair number of "Blue States" in there...
In fact it looks to me like a higher percentage of the residents of Illinois, Connecticut, Rhode Island, New York and Massachusetts ("Blue States" all) would leave the state they live in if they could, then is the case in Mississippi...
You want to check my math on that rube?
I count 3 Red States, 2 Blue, and the rest Purple there...
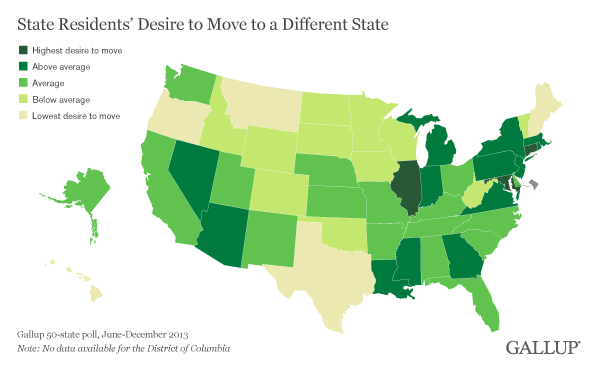
Not seeing a lot of division on "Red-State Blue-State" or "North-South" lines there either...
From that map, people seem particularly miserable about where they live in Illinois, Connecticut and Maryland, and relatively equally miserable in Mississippi, Louisiana, New York and Massachusetts....
While people in Red State Texas and Blue State Oregon are happiest with where they live...
Looks to me like we might need a variable not based on either political orientation or region of the country to explain this...
Re: Benefits magnet
I said that Alabama and Mississippi are relatively unattractive places and thus people won't want to go there. I don't know what stupid-fuck arguments you idiots are trying to make.
The fact that population growth is among the LOWEST in the US rather more supports my point than otherwise. (37th and 40th) Especially in states with the some of the highest teen birth rates (among both white and black teens as I have proven before). But there is the 'birds of a feather' phenomenon and so low-functioning people will be more attracted to low-functioning states.
yrs,
rubato
-
oldr_n_wsr
- Posts: 10838
- Joined: Sun Apr 18, 2010 1:59 am
Re: Benefits magnet
How much of people wanting to move to another state is the "the grass is always greener" mentality.
I would like to move to northeast Pa. some day, but they have the same rating as NY.
I would like to move to northeast Pa. some day, but they have the same rating as NY.
Re: Benefits magnet
Local environmentalists often use the "lets fuck this place up so no more people want to come here" approach as well. Their typical objection to fixing the roads to reduce traffic congestion and make them safer is "but if we do that more people will want to come here".
I've never understood the argument that we should make things worse so that no one else will want to enjoy the place ... where we live.
Especially since we already have had such effective growth control since the late 1970s.
yrs,
rubato
I've never understood the argument that we should make things worse so that no one else will want to enjoy the place ... where we live.
Especially since we already have had such effective growth control since the late 1970s.
yrs,
rubato